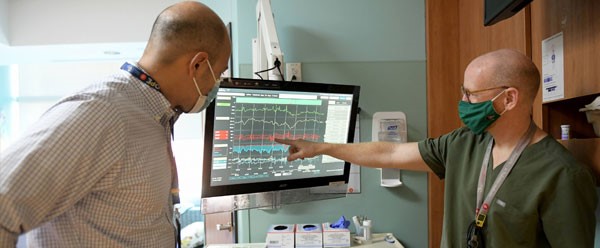
Right, Santiago Borasino, M.D., and left, Hayden J. Zaccagni, M.D.
An enduring issue in pediatrics is that so much of the technology used was developed for adults and must be retrofitted for children. That’s why the new software the cardiovascular ICU (CVICU) at Children’s of Alabama received for its monitoring devices is such a big deal. “It’s unique to the pediatric cardiovascular ICU population because it was developed initially for that population,” said cardiac intensivist Hayden J. Zaccagni, M.D.
The software, called T3 (trajectory, target and trigger), was developed by ICU software development company Etiometry with input from some of the top children’s hospitals in the country. Dr. Zaccagni calls it a “situational awareness tool,” one that pulls information from the telemetry unit, ventilator and other machines and displays all the data on one screen. It also provides past data and trends and uses algorithms to warn staff of the probability of low oxygen levels in the venous blood (a surrogate of a lower-functioning cardiac pump).
With 20 beds in the CVICU that are nearly always filled, anything that makes it easier for the team to track potential problems and potentially improve outcomes is a boon.
The software’s greatest value comes from the historical information it provides, said Dr. Zaccagni. Physicians and nurses can then use objective data to review events and improve their knowledge about what happened and why, he said. For instance, they use the data during extensive reviews of all cardiac arrest occurrences. “It shows the baseline, what happened before the arrest and what happened that led to the physiology failure,” he said. And that can identify opportunities for improvement.
“It provides two things we didn’t have before,” said cardiac intensivist Santiago Borasino, M.D. “The ability to see multiple vital signs trend at the same time on the same screen and the ability to see trends over time right at the bedside without running a report on a different computer.”
“Sometimes the vital signs might look normal, but that might be very abnormal compared to what the patient was experiencing six hours ago,” Dr. Borasino said.
It also improves rounding communication and efficiency, enabling the entire team, including the attending physician, fellow, bedside nurse, dietician, respiratory therapist and pharmacist, to view the patient’s history for the past 12-24 hours at the same time. “We want everyone on the same page,” Dr. Zaccagni said. “The goal is that everyone is aware of patients at risk for having an untoward event.”
The other advantage is the software’s ability to continually recalculate the algorithm based on the changes in vital signs. “As intensivists, we’ve been trained to put together information from different sources to create a picture of whether the patient is fine or not fine,” Dr. Borasino said. But those mental algorithms are fraught by memory and sometimes wrong. The software, however, provides robust data analyses and assigns a probability of a problem.
“The ability to view the history, see multiple vital signs at the same time and see data trends, I think, provides better monitoring and helps us find problems when they’re small rather than when they’re big,” said Dr. Borasino. “Everyone knows when the patient is crashing; the algorithm and the way the information is laid out in front of us might help us act before the patient is crashing.”
No Comments